
Michael S. O'Brien is a principal in the Washington, DC office of Rusk O'Brien Gido + Partners. He specializes in corporate financial advisory services including business valuation, fairness and solvency opinions, mergers and acquisitions, internal ownership transition consulting, ESOPs, and strategic planning. Michael has consulted hundreds of architecture, engineering, environmental and construction companies across the U.S. and abroad.
Investors’ view of the A/E Industry Outlook for 2013 and Beyond
Investors’ view of the A/E Industry Outlook for 2013 and Beyond
February 4, 2013
Reading the Tea Leaves:
The Industry Outlook for 2013 and Beyond
as Told by A/E Public Company Performance
The Industry Outlook for 2013 and Beyond
as Told by A/E Public Company Performance
With a nation nearly evenly divided on politics and economic prospects, expectations for 2012 were anything but certain. And while the outcome of the presidential election may not have quelled the political divisiveness, investors are expressing moderately more confidence in the A/E industry than the overall economy.
That said, uncertainty is still prevalent in the industry as projected long-term growth rates are at historic lows. Of the A/E firms that are expected to exceed the industry long-term growth expectations, (CBI, EME, FLR, JEC, and TTEK) the common denominator appears to be their presence in the energy, water, and environmental market sectors. On the other hand, firms relying heavily on transportation, municipal services, and facilities engineering market sectors face slower growth prospects.
We conducted an analysis of a select group of publicly traded companies doing business in the architecture, engineering, and environmental consulting industry to gauge the investors’ outlook for 2013 and beyond. This analysis is based on the fundamental fact the stock price of a publicly traded company is a function of three key factors: 1.) The company’s current earnings per share (“EPS”), 2.) The projected long-term growth rates of the current EPS, and 3.) The risk of not achieving the current EPS along with its projected growth rate.
In our analyses of these companies, we’ve made adjustments to reported earnings for extraordinary or non-recurring income or expense items because investors will typically discount one-time events that may impact the reported earnings results. Interestingly, the most common extraordinary expenses we found were write-downs of goodwill. Goodwill write-downs occur when a firm recognizes that the goodwill value of a recent acquisition has been “impaired.” In other words, it would appear that some of public firms have had to acknowledge that they paid too much for recent acquisitions, and/or that those acquisitions have not performed as hoped.
Using the capital asset pricing model (“CAPM”), a theoretical financial tool, to determine a company’s cost of capital we can determine investors’ sentiment for a company. The following table shows a summary of companies and their respective cost of capital, current price to earnings ratio (“P/E”), next fiscal year (“NFY”) P/E multiples, and our calculation of the implied growth rates.
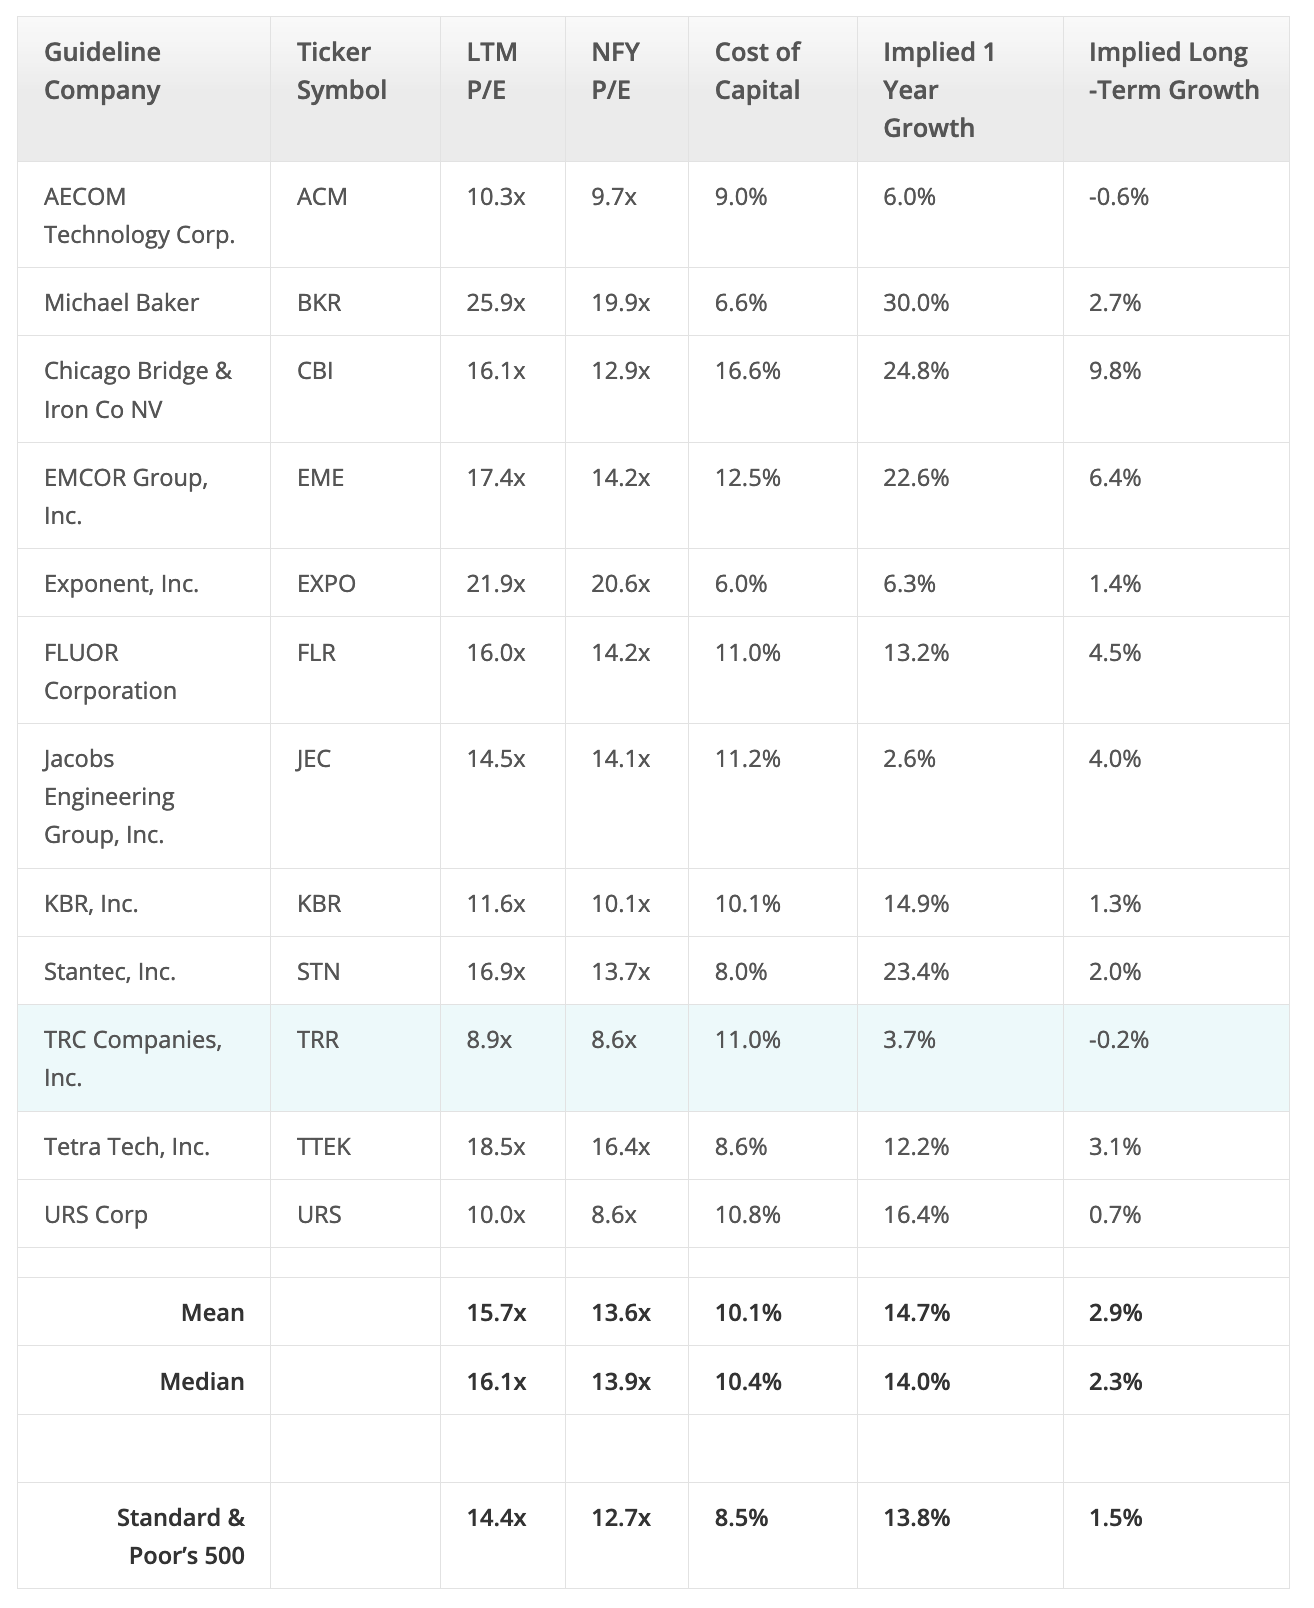
The cost of capital is the required rate of the return expected by investors – most of which are institutional – based on their understanding of the underlying risk of each of these companies’ current EPS and their respective projected growth rates. A higher cost of capital (or greater required rate of return) reflects the higher level of risk that investors are placing on a company’s ability to achieve the projected near-term and long-term growth rates. The P/E multiple is the price at which the stock is trading relative to the companies’ earnings per share, and NFY P/E is the price at which the stock is trading relative to the companies’ NFY earnings per share. The implied one year growth is calculated by taking the current P/E multiple and dividing by NFY P/E and subtracting 1. The implied terminal growth rate is the derivative of the LTM P/E and the companies’ cost of capital.
A cautionary note; when trying to infer an entire industry’s outlook based on public firm stock performance it’s very important to look at a basket of companies instead of any one firm in particular. There could be unique facts and circumstances driving investors’ assessments of any particular firm. For example, Michael Baker is priced at the highest P/E multiple for the industry. But this could well be due to the recent departure of the firm’s CEO and inquiries from private equity firms looking to take the company private. And in the case of Chicago Bridge and Iron, investors have already begun to price in the benefits of the CBI’s impending acquisition of the Shaw Group. For this reason, we examined a group of 12 firms and compared their stock performance to that of the S&P 500.
The S&P 500, consisting of the largest publicly traded companies, is considered the barometer of the overall market in the United States. According to the table above, investors are expecting both near term and long term growth rates of the A/E sector to outperform that of the overall market. Historically, the A/E sector has grown at a slower pace than the S&P 500, so this is somewhat unusual. At the same time investors are currently placing a higher investment risk on companies in the A/E sector compared to the S&P 500. This higher risk is also unusual. Historically investors have viewed firms in the A/E sector as less of an investment risk when compared to the overall market because much of the business of these firms is generated directly or indirectly from federal, state, and local governments. This may indicate that investors do not view the public sector markets as positively as they once did.
The market appears to be particularly skeptical about the A/E industry’s near term growth. This is evidenced by the fact that the difference in the 2013 growth rates between A/E firms (14.0%) and the S&P 500 (13.8%) is virtually non-existent, yet the risk rate differential between the A/E industry and the S&P 500 is 1.9%–a spread that is quite large in the finance world. In the long-term, however, investors are expressing more optimism for the A/E industry when compared to the overall market. A/E firms are expected to grow 2.3% in the long run compared to the overall market growth projection of 1.5%. While this spread is 0.8%, the risk spread is still 1.9%. Therefore it appears that investors are more confident in the A/E industry in the long-run. This is good news for the industry, as long-term growth prospects trump short-term growth anytime.
But before we get too excited, let’s not lose sight of the fact that these growth expectations are still relatively low. An overall broad market long-term growth rate of 1.5% is well below the level needed to significantly reduce unemployment and improve fiscal conditions at the federal, state, and local levels. By some estimates a GDP growth rate of 3% or higher is needed.
We suspect that the relatively low growth expectations reflect the continued uncertainty stemming from Washington’s inability to come to a resolution on the fiscal cliff and other legislative matters. On a positive note, of the many different market sectors, the A/E sector is perhaps best poised to benefit from almost any fiscal resolution coming out of Washington. So let’s all keep our fingers crossed.
Mark Your Calendar!
Latest Perspective
Perfecting the A/E Exit Strategy – Five Key Factors
An enormous A/E generation that kicked off their careers in the 1980s and subsequently started firms or became owners in the 1990s ...

Studies
Latest Transactions
Financial Experts for Architects, Engineers, and Environmental Consulting Firms